![<?echo $_SERVER['SERVER_NAME'];?>](/template/twentyseventeen/skin/images/header.jpg)
1 Introduction
In the intermediate visual area, the area between dark vision and bright vision (the brightness is between 0.001 cd / m2 and 10 cd / m2), the visual function of the human eye is determined by both the rod cells and the pyramidal cells. The efficiency function changes as the human eye adapts to changes in brightness. Therefore, if the photometric efficiency function of the bright visual spectrum is used for photometric measurement of all brightness levels, it will lead to erroneous evaluation results. Intermediate vision lighting includes road lighting, tunnel lighting, emergency lighting, parking lot lighting, airport lighting, dashboard lighting, aerospace cockpit lighting, certain traffic signal lighting, military lighting, medical lighting, and security lighting.
Intermediate visual photometry has been a topic of concern to the international lighting community for decades (CIE, 1989, CIE, 2001). Until the mid-1990s, most of the research in this field used the brightness matching method. CIE81-1989 "Intermediate Visual Photometry: History, Special Problems, and Solutions" describes an intermediate vision system based on the brightness matching method. CIE 141—2001 “Testing the Photometric Supplementary System†updates the original system, pointing out that it is not possible to use a single photometric model to describe the characteristics of intermediate vision. Corresponding to different conditions of use and brightness, an appropriate photometric model should be selected to properly evaluate the lighting effect of the environment to achieve effective lighting, energy saving and safety.
By the late 1990s, intermediate visual photometry based on visual functioning has attracted the attention of the international lighting community (Goodman, 1997, McGowan and Rea, 1994). The method uses a specific visual task to determine the spectral luminous efficiency function by measuring the human eye's ability to detect, identify, and react to visual targets. The visual function method is more direct and practical than the brightness matching method. For example, when driving a car, people do not need to visually assess the relative brightness of adjacent areas of the road surface, and more importantly, can detect and identify objects under visual extreme conditions. Chinese scholars have been active in the field of intermediate vision research, and have achieved fruitful results in the theoretical research and practical application of intermediate vision, and participated in the compilation of CIE191: 2010 "Vision-based intermediate vision photometric recommendation system".
In 2010, CIE191 recommended four intermediate visual photometric models, but so far there has been no comprehensive systematic analysis of these photometric models, and intermediate visual light measurement instruments have not been available. Many lighting design and application users have intermediate vision. The concept is still unclear, let alone the application. In this paper, a comprehensive and systematic analysis of the characteristics, application scope and application considerations of the four intermediate vision models of CIE191: 2010 is carried out, and an intermediate visual light measurement test instrument is designed to measure the light metric and illumination of the luminaire under clear vision and intermediate vision. Efficiency enables intermediate vision models to be applied correctly and efficiently in lighting measurements and designs.
2 CIE 191—2010 Recommended intermediate vision model
2. 1 Introduction to the intermediate vision model
Since CIE photometry follows the principle of additive (CIE, 1978), the intermediate visual photometric model should also satisfy the principle of additive. The principle of additiveity states that for a given amount of spectral radiation, the corresponding spectral metric can be obtained by linearly adding in the specified spectral range by weighting the appropriate spectral luminous efficiency function. Therefore, the intermediate visual luminosity system must satisfy two constraints: (1) additive; (2) the spectral visual efficiency function of intermediate vision tends to the spectral optical efficiency function of bright vision as the brightness increases, with the brightness Reduce the spectral light efficiency function toward dark vision. The simplest form of an intermediate visual photometric model that satisfies these constraints is a linear combination of light and dark visual spectral light efficiency functions, namely:

Where x is the brightness adaptation factor.
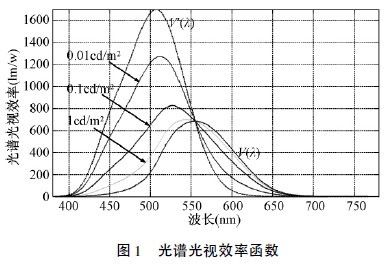
Since both V ( λ) and V' ( λ ) satisfy the additive, the intermediate visual spectral luminous efficiency function Vmes( λ ) defined by equation ( 1 ) naturally satisfies the additive property. Figure 1 shows the variation of spectral luminous efficiency function (unnormalized) with brightness. It can be seen from the figure: As the brightness increases, the spectral luminous efficiency function gradually transitions from dark vision to bright vision. Since the intermediate visual spectral light efficiency function depends on the brightness adaptation state of the human eye, the additiveness only holds for a given level of brightness adaptation.
Two recently proposed visual function-based intermediate vision models, the UPS model (Rea et al., 2004) and the MOVE model (Goodman et al., 2007), use the form shown in equation (1) to visualize and Dark vision is linked and satisfies the principle of additiveity. In addition to the USP model and the MOVE model, the CIE also proposes an Intermediate system. The intermediate model also takes the form shown in equation (1), and like the MOVE model, the relationship between the luminance adaptation coefficient and the intermediate visual brightness is a “log-linear†relationship, but the upper and lower limits of the intermediate visual region are adjusted. .
2. 2 USP model
The work of He et al. (1997, 1998) laid the experimental foundation for the USP model. In 1997, He et al. measured the reaction time of the human eye under eight brightness levels of high-pressure sodium lamps and metal halide lamps (between 0. 003 cd / m 2 and 10 cd / m 2 ). The experimental conditions are: target contrast C = 2. 3; the spectral power distribution of the measured object and the background is consistent, that is, the visual task is a non-colored stimulus with only brightness contrast and no color contrast. The experimental results show that when the brightness is higher than 0.6 cd / m2, the rod cells do not contribute to the response time of the visual task. In 1998, He et al. used the reaction time difference between the two eyes to measure the optical visual efficiency function of the intermediate visual spectrum, and obtained an iterative method for calculating the intermediate visual brightness.
In 2004, Rea et al. proposed a unified USP photometric model based on the research of He et al., in the form shown in equation (1). The middle visual brightness and brightness adaptation coefficient of the USP model can be calculated by a mathematical formula in a closed form, and the intermediate visual area is between 0.001 cd / m 2 and 0.6 cd / m 2 .
2. 3 MOVE model
The MOVE model (Eloholma et al., 2005, Goodman et al., 2007) is based on a study of the ability to detect, perceive, and target details during nighttime driving. Visual targets include colored targets and achromatic targets. The experimental conditions are: background visual brightness 0. 01cd / m2, 0. 1 cd / m2, 1 cd / m2 and 10 cd / m2 (some experiments also use 0.3 cd / m2 and 3cd / m2); target eccentricity 0° and 10°; target angle of view 2° (and 0. 29°); target display time Δt ≥ 3s (using Δt ≤ 500ms in some reaction time measurements); contrast is near the critical value; Quasi-monochromatic source and wide-spectrum source with a half-width of 10 nm; most of the experimental targets and backgrounds use different colors (with color difference conditions), while some experimental targets and backgrounds use the same color (achromatic conditions); The tester is 109 bits.
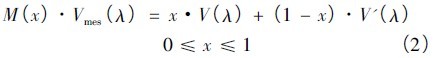
According to the experimental results, the intermediate visual photometric model of peripheral vision is obtained (Goodman et al., 2007). The form is as shown in equation (2). The difference from equation (1) is that the maximum value of Vmes(λ) is increased. The normalization function M ( x) of 1. The intermediate visual brightness and brightness adaptation coefficients of the MOVE model are calculated by an iterative method, and the intermediate visual area is between 0.01 cd / m 2 and 10 cd / m 2 .
2. 4 intermediate model
Although the results obtained by calculating the intermediate visual brightness using the USP model and the MOVE model are different (especially for light sources with low brightness and high color saturation), most white light sources for general illumination (such as road lighting at night, etc.) ), these differences are small even at all brightness levels. In practical applications, the results obtained from the two models are relatively close, and the main difference between them is the difference between the intermediate vision and the clear visual boundary. The cut-off point of the MOVE model is considered too high (Rea and Bullough, 2007), while the cut-off point of the UPS model is considered too low (Eloholma and Halonen, 2006).
The USP model and the MOVE model represent two extreme cases. In the USP model, only the reaction time is measured, regardless of the color effect, so it is only suitable for achromatic visual tasks; a broader visual task is considered in the MOVE model, due to the human eye in different visual tasks. The nonlinear interaction of color channels and achromatic channels makes the transition from dark vision to bright vision very complicated, introducing more uncertainty into the test results. The USP model uses fewer observers (3) to reduce “noiseâ€, while the MOVE model uses more observers (109) to reduce the impact of individual differences between observers. It must be pointed out that although the MOVE experiment includes achromatic and colored visual tasks, it is dominated by color vision tasks. In the real world such as driving at night, both the achromatic vision task and the color vision task are included, so the MOVE model may not be considered for the achromatic vision task. In order to make the model more applicable and give more consideration to the achromatic vision task, an intermediate model between the USP model and the MOVE model, namely MES1 and MES2, is proposed, and the form is also shown in equation (2). The intermediate visual area of ​​the MES1 model is 0. 01 cd / m 2 ~ 3 cd / m 2 , and the MES 2 model is 0. 005 cd / m 2 ~ 5 cd / m 2 .
In most cases, the MES2 model is more consistent with the measured data than the MES1 model. Therefore, CIE recommends the MES2 model as the recommended model for visual function-based intermediate visual photometry. The calculation formula is as follows:
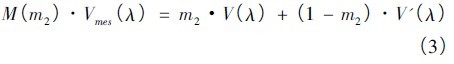
Where M ( m2 ) is a normalization function that makes the maximum value of the optical visual efficiency function Vmes( λ) of the intermediate visual spectrum 1; m2 is the luminance adaptation coefficient: if Lmes≥5. 0cd /m2, then m2 = 1; Lmes≤0. 005cd /m2, then m2 = 0; if 0. 005cd /m2 < Lmes <5. 0cd /m2, then m2 = 0. 3334lgLmes + 0. 7670; Lmes is the intermediate visual brightness, the formula is as follows:
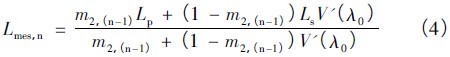
Where Lp is the bright visual brightness; Ls is the dark visual brightness; V' (λ0) = 683 /1699, which is the value of the dark visual spectrum optical efficiency function at 555 nm; n is the number of iteration steps.