![<?echo $_SERVER['SERVER_NAME'];?>](/template/twentyseventeen/skin/images/header.jpg)
This article guides reading
When it comes to communication issues in the automotive electronics industry, we naturally think of protocols such as CAN, LIN, CANFD, and Car Ethernet. So when engineers are debugging such communication problems, it is very important whether the oscilloscope has the analysis plug-in of the relevant protocol. How do these analysis plug-ins help engineers solve problems?This article will focus on three aspects of oscilloscope Ethernet analysis , on-board bus protocol decoding , CAN bit time test to describe.
First, Ethernet analysis
Currently, the most important application of in-vehicle Ethernet is the domain controller. In addition to domain controllers and lidars, these require high bandwidth and new computing architectures. Another point is the need to reduce costs.
As shown in Figure 1, it is a typical automotive network architecture.
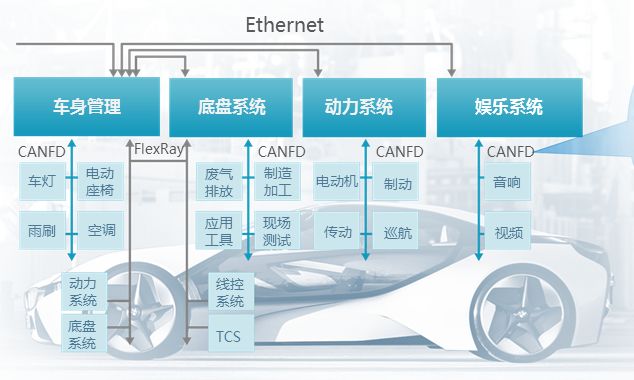
Figure 1 Typical Automotive Network Architecture
Like the CAN bus, Ethernet needs similar tests to ensure the stability of communications. This includes testing of eye diagram tests, jitter, amplitude characteristics, rise and fall times, and duty cycle distortion. Through these several tests, you can basically judge whether the performance of Ethernet is good.
In order to take into account the overall automotive test requirements, including conventional voltage and current signals, bus tests such as CAN and LIN, and Ethernet testing. ZLG Zhiyuan Electronics' ZDS4054 Plus, the latest firmware supports 100M Ethernet (100Base-TX) analysis.
The test requires one ZTF100B adapter board, two SMA to BNC cables, one parallel cable to connect an oscilloscope, and one parallel or crossover cable to connect to the device under test.
As shown in Figure 2, for the test connection diagram, the other end of the yellow network cable is plugged into the network port on the back of the oscilloscope, and the other end of the black network cable is connected to the Ethernet port under test.
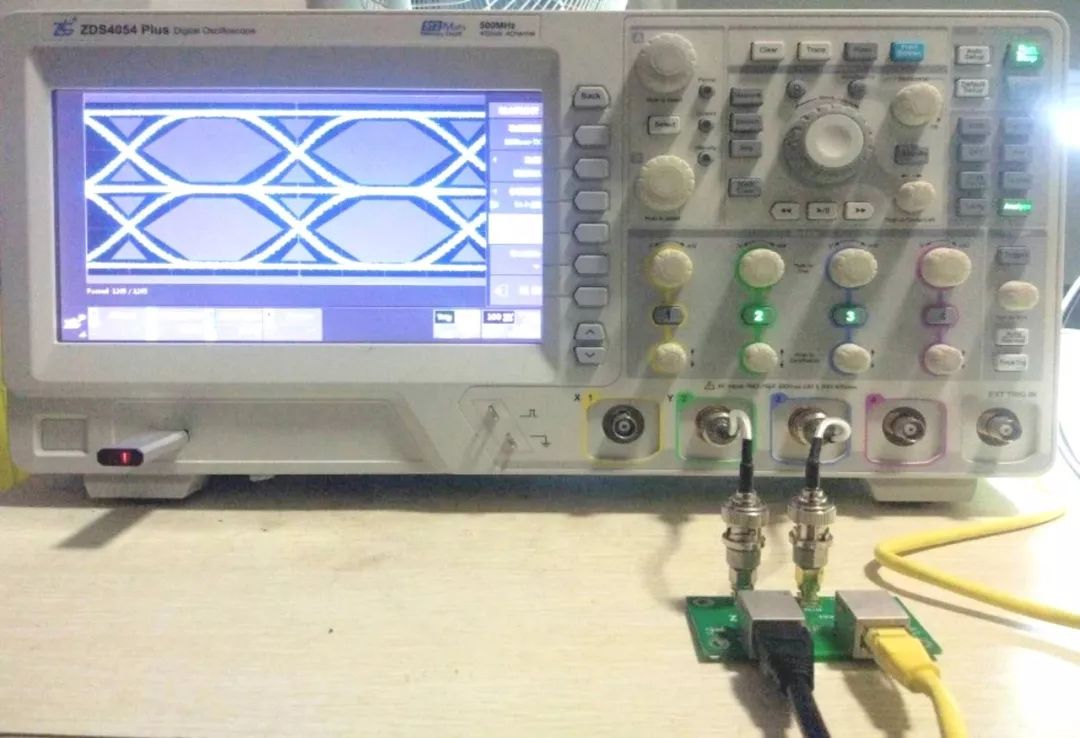
Figure 2 Ethernet analysis test connection diagram
Figure 3 shows an eye diagram analysis test for 100Base-TX.
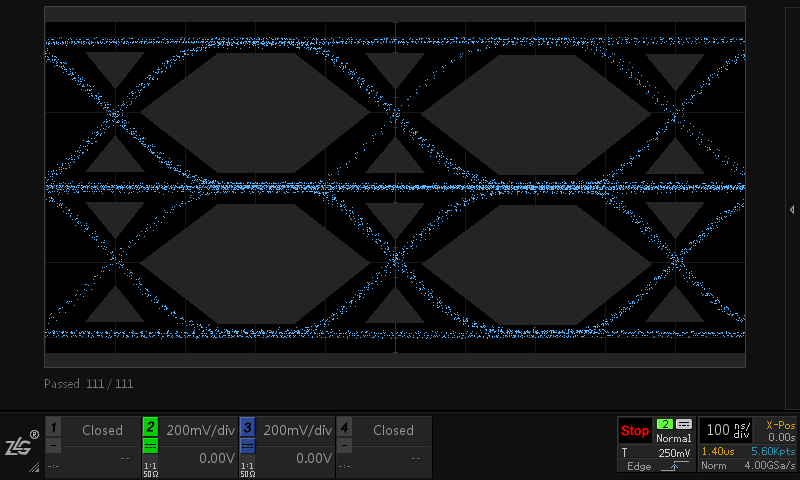
Figure 3 Eye pattern analysis of 100Base-TX
In addition to the eye diagram test, it also supports sending jitter test, amplitude characteristic test, rise and fall time test, and duty cycle distortion test. As shown in Figure 4.
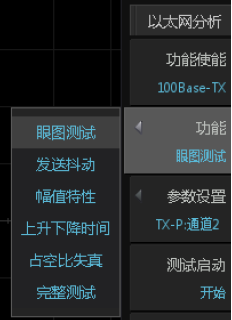
Figure 4 Send jitter and other tests
As shown in FIG. 5, a full test function can be used, and the full test function includes the above eye diagram, transmission jitter, amplitude characteristics, and the like.
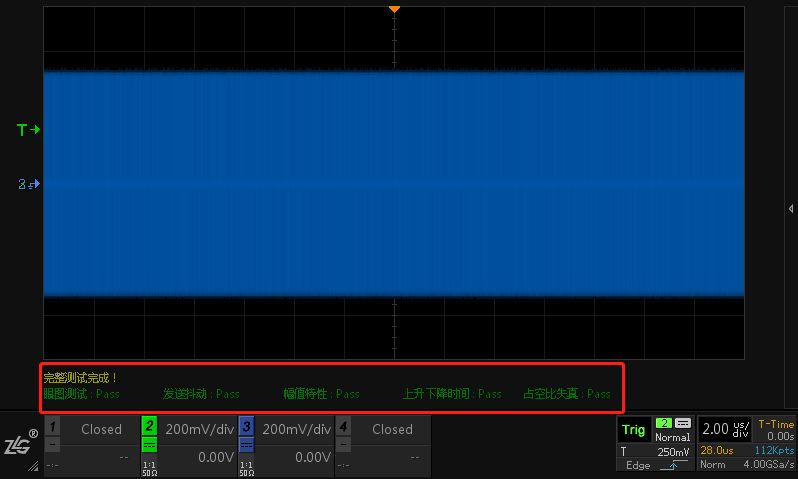
Figure 5 Ethernet analysis complete test
After the end of the overall test, the web page report can be exported to facilitate the use of the report by engineers. As shown in Figure 6, Figure 7.
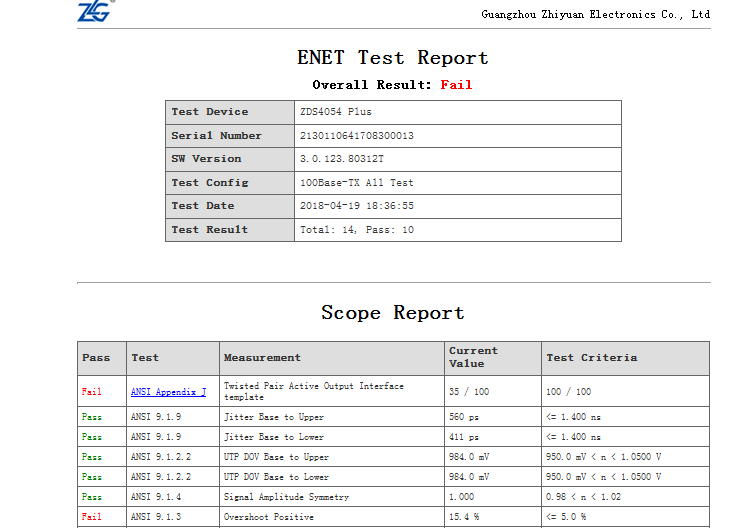
Figure 6 Web Reports for Overall Testing
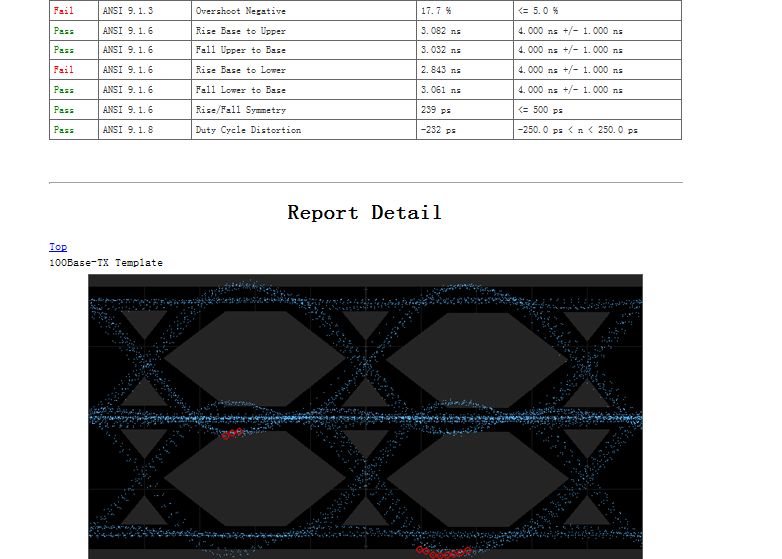
Figure 7 Web Reports for Overall Testing
Second, analysis of common protocols such as CAN, LIN, and CANFD
As mentioned before, in addition to Ethernet analysis, the ZDS4054 Plus is also a standard one for the decoding of CAN, LIN, FlexRay, CANFD, and SENT protocols commonly used in automotive electronics.
Automotive electronics industry requirements for oscilloscope parameters and functions:
Protocol decoding: compatible with all major automotive communication protocols, CAN, LIN, FlexRay, SENT, CANFD;
Large memory depth: Instead of simply decoding a frame of waveform, it can completely monitor the entire communication process;
Parameter measurement: It is necessary to support the measurement of various parameters such as baud rate and bus load rate.
The above three points are as follows:
1, free standard more than 30 kinds of protocol decoding: including the automotive electronics industry commonly used CAN, LIN, FlexRay, SENT, CANFD. Compared with other oscilloscopes in the industry that require payment options and generally only support one frame waveform decoding, the ZDS4054Plus can support 70s CAN waveform decoding based on 512M memory depth, and its large storage can guarantee the monitoring of the entire communication process, as shown in Figure 8 and Figure 9 Show.
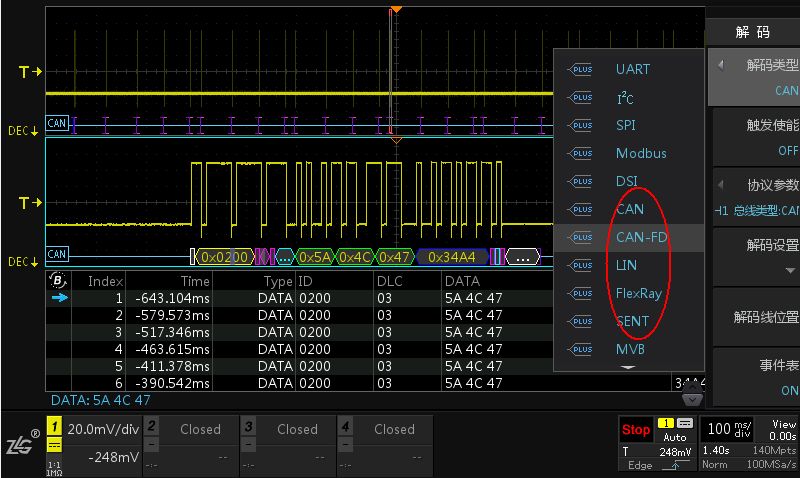
Figure 8 Free standard 30+ protocol decoding
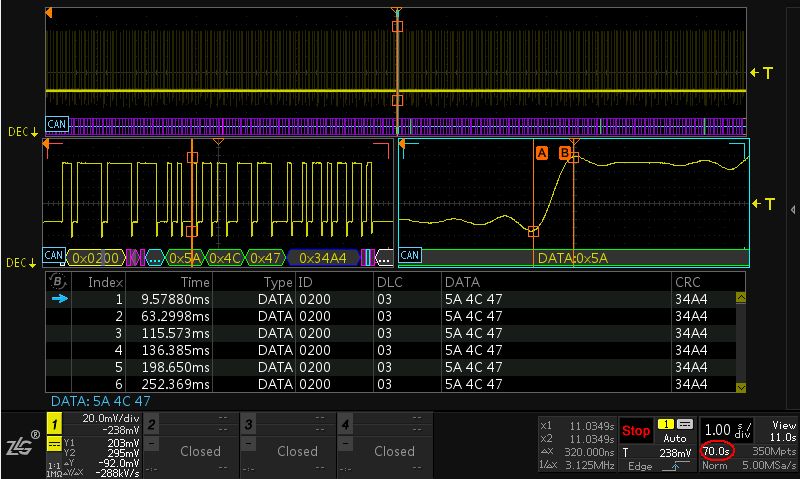
Figure 9 70s CAN waveform decoding
2. Event table with full memory depth and full protocol decoding: all waveforms at 512M memory depth can be decoded and displayed in the event table. The event table can observe the time, frame type, IDField, data, etc. of a particular frame waveform, which greatly facilitates our analysis of the waveform. Figure 10 shows the decoding of the LIN protocol.
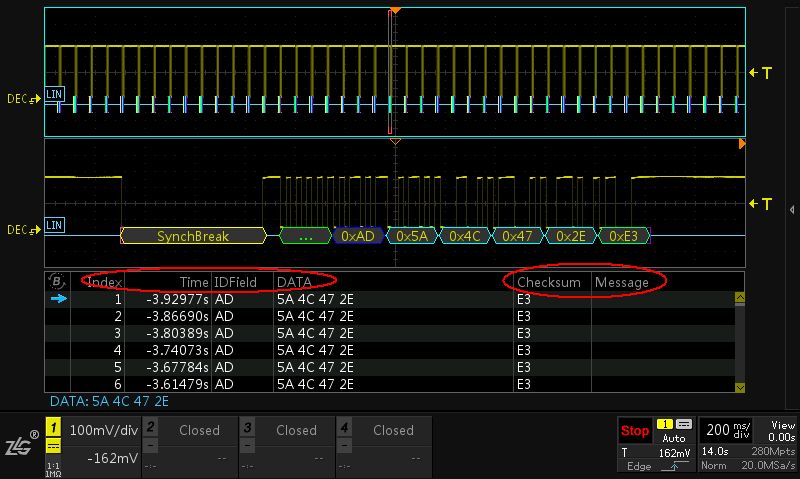
Figure 10 decoding of the LIN protocol
3, support for CAN bus baud rate, load rate measurement: ZDS4054 Plus supports 51 kinds of parameter measurement, 24 kinds of screen display. The only direct support for CAN bus baud rate, load rate direct measurement, all measurements are all FPGA hardware acceleration, even if the 512M waveform data measured less than 1s. Figure 11 shows the CAN bus baud rate, average and instantaneous load rate measurements.
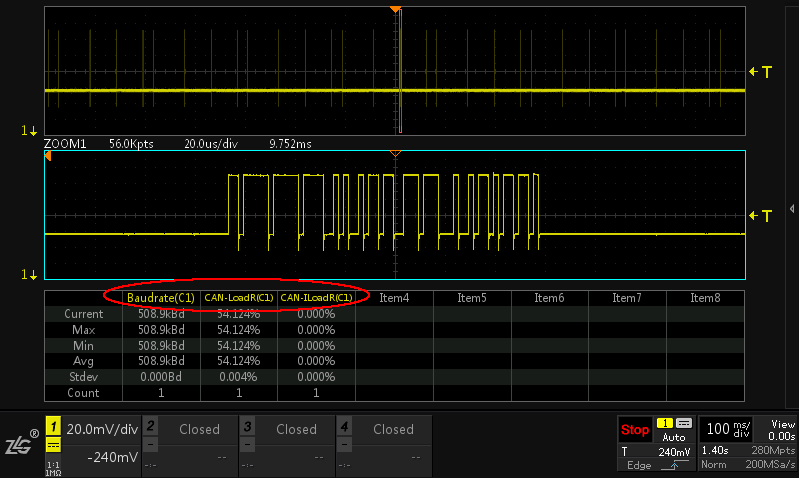
Figure 11 CAN bus baud rate, load rate measurement
Third, CAN bit time test
1, why pay attention to the CAN bus bit time?
The automotive CAN bus design specification has strict rules for the differential signal bit time (ie baud rate) of the CAN node: the signal bit time of each node of the same bus must maintain a high degree of consistency, otherwise an error frame may appear after the node combination, possibly Causes no communication between nodes.
2. How can the bit time of the CAN bus be measured?
The steps specified in the "Automobile Link Layer Test Standard GMW14241 JUNE 2012" are as follows:
Select the appropriate conditions for the DUT under test, and use the oscilloscope to trigger the displayed waveform;
Measure the edge time of the recessive-dominant differential level of 20-30 consecutive bits, and calculate the average time of one bit.
Repeat at least 100 times to determine the maximum and minimum values.
Among them, single frame CAN bit time test method is shown as in Fig. 12.
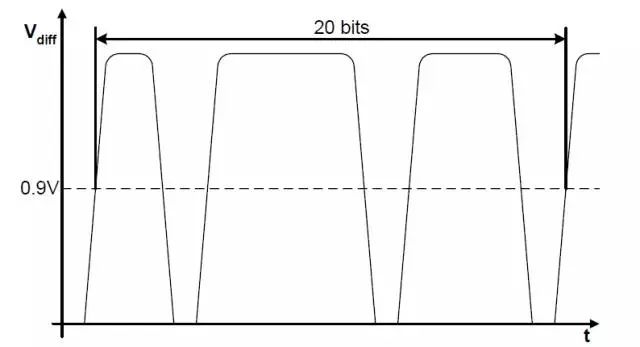
Figure 12 Single frame CAN bit time test method
3, the traditional oscilloscope CAN bit time testing difficulties
Engineers need to have at least 20*100=2000 waveforms from left to right on the screen, and need to complete 100 manual calculations and data recordings, and then finally determine the maximum and minimum values.
4, ZLG Zhiyuan Electronic Oscilloscope Solution
If you need to measure 100 frames, you can run 100 frames of data in the upper right corner. At the same time, the upper and lower limits required by the corresponding depot can also be entered in advance to simulate the acceptance of the depot. If the test value is within the required range, the pass result is directly given. Otherwise, fail, as shown in Figure 13.
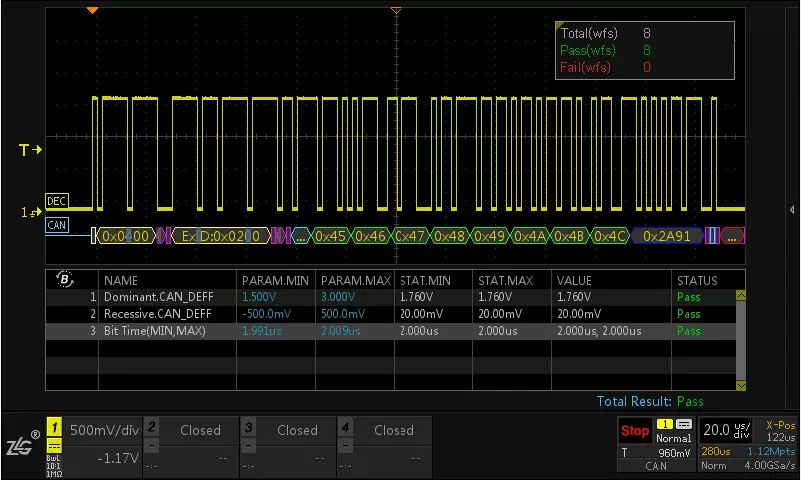
Figure 13 CAN bit time frame statistics and measurement results
After the test is completed, the waveforms and data tested can be exported. Exported "Web Reports" files can be opened using web pages, and exported "CSV" files can be opened using Excel. A partial screenshot of the web report export file is shown in Figure 14.

Figure 14 CAN bit time test result report
Position Selector Switch,Rotary Selector Switch,Pole Rotary Switches,Ceramic Rotary Switch
Foshan City Jiulong Machine Co., Ltd , https://www.jlthermostat.com